Home>Insights>Blogs > The 5 Recruitment KPIs Every Boardroom Tracks Closely
The 5 Recruitment KPIs Every Boardroom Tracks Closely
Introduction: Talent as the New Boardroom Currency
In today’s economy, the difference between growth and stagnation often comes down to one factor: how fast and how well you hire.
Board members no longer view recruitment as a back-office function. It’s a strategic investment, directly tied to revenue, innovation, and enterprise value. A misstep in talent acquisition can delay product launches, derail digital transformation programs, or inflate costs by millions.
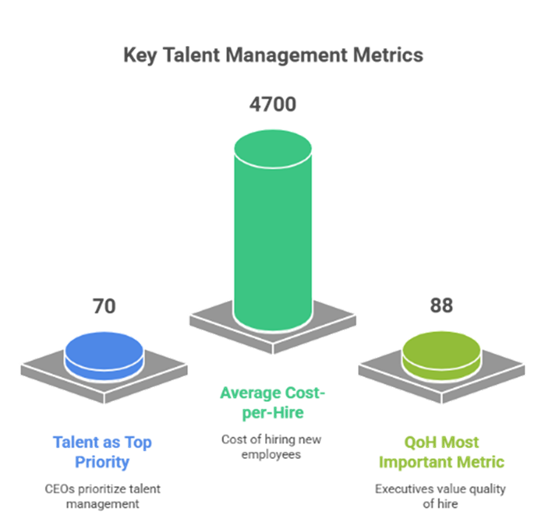
McKinsey (2025): 70% of CEOs list talent acquisition and retention among their top three strategic priorities.
Gartner (2025): Enterprises with optimized recruiting pipelines are 2.3x more likely to achieve above-industry profitability.
But here’s the challenge: many HR teams struggle to frame these numbers in a way that resonates with executives. Recruiters may report “time-to-fill” in days, but boards want to hear “$2M in project revenue safeguarded.”
This blog unpacks the five recruitment KPIs every boardroom tracks closely, and shows how HR leaders can measure, benchmark, and present them in financial and strategic terms.
The 5 Recruitment KPIs Every Boardroom Tracks Closely
KPI 1 – Cost-per-Hire: The ROI Pulse of Talent Acquisition
When CFOs open a hiring dashboard, this is the first number they scan—it’s the pulse of financial efficiency inside the talent engine. Cost-per-Hire (CPH) tells boards whether an organization is spending smart or simply spending.
In a market where the average cost-per-hire is $4,700 (SHRM), that figure can easily triple when factoring in job-board ads, technology licenses, recruiter time, and onboarding overheads. Enterprises that monitor this metric tightly safeguard millions in workforce ROI.
The best-performing companies treat cost-per-hire not as a budget line but as a strategic lever—one that funds innovation and retention. At Compunnel Talent Solutions, direct-sourcing frameworks and analytics-driven workforce models routinely help enterprises reduce CPH by 40–60 percent, converting savings into growth and engagement initiatives.
KPI 2 – Time-to-Fill: The Clock That Measures Lost Opportunity
Every unfilled seat quietly costs revenue. Whether it’s a developer delaying a release or a sales rep missing a quarter, vacancies drain momentum.
Gartner (2025) pegs the average Time-to-Fill at 44 days, while IDC estimates each vacant day costs about $500 in lost productivity. Boards interpret faster hiring not as speed for its own sake, but as revenue protected.
Through AI-powered sourcing, automated outreach, and pre-vetted talent pools, Compunnel Talent Solutions helps clients cut TTF by 30–50 percent, ensuring business priorities never wait on hiring cycles.
KPI 3 – Quality of Hire: Turning Speed into Sustainable Performance
Hiring fast gets headlines. Hiring right sustains performance. Quality of Hire (QoH) is the measure boards trust most—it links talent decisions to long-term business outcomes.
LinkedIn Talent Trends (2025) found that 88 percent of executives rank QoH as their top hiring metric, because it reflects the real impact of recruiting on output, engagement, and retention.
Compunnel’s quality framework integrates structured assessments, AI-driven matching, and post-hire analytics to ensure shortlists align with business KPIs—not just job descriptions. The result: 14 percent higher first-year performance ratings and 25 percent improvement in retention versus transactional models.
KPI 4 – Retention & First-Year Attrition: Protecting the Investment
Attrition is the silent leak in every workforce budget. Replacing employees who leave within a year costs up to 150 percent of their annual salary (Work Institute, 2025). Boards interpret high attrition not as HR failure but as capital erosion.
High first-year turnover often stems from poor onboarding or cultural misalignment. When corrected with analytics and structured engagement, retention becomes one of the most profitable KPIs in the talent portfolio.
At Compunnel Talent Solutions, data-led retention strategies and personalized onboarding frameworks help clients cut first-year attrition by 20–30 percent, protecting millions in rehiring and training costs.
KPI 5 – Talent Pipeline Health: Predictability as a Strategic Advantage
Predictability is power. Healthy pipelines let boards sleep at night knowing critical roles, niche skills, and leadership transitions are already mapped and ready.
Deloitte Human Capital Trends (2025) reports that 60 percent of executives cite lack of pipeline visibility as a major business risk. Weak pipelines mean delayed projects, lost bids, and scrambling for talent in high-demand markets.
Through evergreen talent pools, AI-based sourcing, and proactive workforce mapping, Compunnel Talent Solutions helps clients maintain 3:1 candidate-to-role ratios across critical functions, ensuring business continuity, diversity, and readiness.
Boardroom Takeaway
These five KPIs are no longer “HR numbers.” They are business-performance indicators that directly influence margins, agility, and shareholder confidence.
When HR leaders translate hiring data into financial language—dollars saved, revenue gained, risks mitigated—boards start listening.
With Compunnel Talent Solutions, organizations turn these metrics into measurable impact—building transparency, precision, and scalability across the entire hiring lifecycle. Because when every metric speaks ROI, talent becomes the most accountable investment in the enterprise.
Beyond the Big Five: Supporting Metrics Boards Still Ask About
While the five KPIs above form the backbone of board reporting, forward-looking directors often probe secondary recruitment metrics to test the depth and resilience of HR reporting.
Diversity Hiring Ratios
Boards, particularly those under ESG mandates, expect disclosure of DEI outcomes.
Metric: % of underrepresented groups hired, promoted, or retained compared to targets.
Board framing: “We met 45% of our DEI hiring target, moving us closer to ESG compliance and mitigating reputational risk.”
Candidate Experience Score (CES)
Poor candidate experience can hurt employer brand and raise offer declines.
Metric: Post-application surveys, NPS for candidates.
Board framing: “Improving CES by 15 points reduced offer decline rates by 12%, lowering vacancy risk.”
Offer Acceptance Rate (OAR)
Boards view OAR as a proxy for market competitiveness.
Board framing: “An 85% OAR reflects competitive positioning in a tight labor market.”
Hiring Manager Satisfaction
Often overlooked, but boards ask: “Are our leaders happy with the talent we’re bringing in?”
Metric: Post-hire survey scores.
These supporting metrics provide contextual richness when boards drill deeper.
Case Study Snapshots: How Leading Enterprises Present KPIs
Executives pay attention to stories anchored in numbers. Here are 3 anonymized case snapshots that show how HR leaders have reframed recruitment KPIs for the boardroom.
Case 1: Global Bank – Time-to-Fill as a Revenue Driver
Challenge: Senior tech roles took 62 days to fill, delaying a digital payments rollout.
Action: Implemented AI-enabled sourcing via Compunnel Talent Solutions.
Outcome: Reduced TTF to 39 days.
Boardroom framing: “Accelerated launch by 23 days, unlocking $6.2M in quarterly transaction revenue.”
Case 2: Healthcare Network – Attrition as Financial Leakage
Challenge: 1-year attrition at 38% among frontline nurses.
Boardroom framing: “Protected $4.1M in rehiring costs and stabilized patient care continuity.”
Case 3: Tech Enterprise – Pipeline Health as Risk Mitigation
Challenge: Succession gaps for critical cybersecurity leadership roles.
Action: Built AI-powered pipeline visibility dashboards.
Outcome: 3:1 candidate-to-role ratio achieved.
Boardroom framing: “Mitigated leadership continuity risk during cloud security expansion.”
Building a Board-Ready KPI Dashboard
Numbers only resonate when presented as concise, visual insights. Boards don’t want Excel dumps; they want dashboards that tie hiring metrics to outcomes.
Elements of a Board-Ready Dashboard
1. Financial Translation
Convert metrics into cost saved, revenue gained, or risk mitigated.
Example: “Reducing attrition by 6% saved $5.2M.”
2. Benchmarking Layer
Compare against SHRM, Gartner, or industry peers.
Example: “Our TTF is 11 days faster than industry average.”
3. Trend Visualization
Show 3–5 year YoY improvement.
Example: Line graph showing steady QoH rise.
4. Red/Green Signals
Use simple visuals (✓ vs ✗) to highlight risks and wins.
5. Executive Headlines
Each chart needs a board-level takeaway.
Example: “Hiring speed gained us $3M in product revenue.”
Compunnel Talent Solutions designs KPI intelligence dashboards that make hiring insights board-ready, blending financial proof, benchmark context, and executive storytelling.
Boards want insight, not just data. To translate KPIs into board-ready insights:
Dollarize metrics: Convert time, attrition, and quality into financial impact.
Benchmark externally: Use SHRM, Gartner, and LinkedIn data to frame performance.
Show trend lines: Boards want progress, not snapshots.
Align with strategy: Tie metrics to revenue growth, innovation, compliance, and ESG.
Example framing:
“Reducing cost-per-hire and time-to-fill by 20% freed $3.2M, which funded our DEI hiring program — strengthening both financials and ESG compliance.”
Future Outlook: The Next Era of Recruitment KPIs (2026–2028)
Recruitment KPIs are evolving. Over the next three years, boards will demand:
AI Impact Metrics
% of hires sourced and screened via AI.
Analyst hours saved through automation.
2. Skills-First Metrics
Time-to-skill readiness vs time-to-fill.
Skill gap closure rates.
3. Diversity & ESG-Linked Metrics
Diversity pipeline ratios tied to ESG reporting.
Retention of underrepresented groups.
4. Workforce Agility KPIs
% of critical roles with succession-ready candidates.
Ratio of internal mobility vs external hiring.
Boards will also expect KPIs to be reported with the same rigor as financial statements — audited, consistent, and dollarized.
Conclusion: Recruitment KPIs as a Boardroom Advantage
The five KPIs we’ve explored — cost-per-hire, time-to-fill, quality of hire, retention, and pipeline health — are no longer “HR metrics.” They are enterprise health indicators.
Boards want proof that talent strategy fuels business strategy. That every dollar invested in hiring returns multiples in growth, resilience, and continuity.
At Compunnel Talent Solutions, we help HR leaders transform these KPIs into evidence pipelines — data-driven insights that resonate with executives. From AI-native sourcing to compliance-first analytics, we enable enterprises to hire smarter, faster, and with measurable ROI.
Ready to make your recruitment KPIs boardroom-ready? Book a strategy session with Compunnel Talent Solutions.
VP of Finance & Operations with 25+ years of experience spanning Finance, Operations, and Global Workforce Management. She specializes in Employer of Record (EOR) solutions, multi-state payroll, and compliance frameworks across diverse geographies. Lalitha offers a strategic lens on managing global workforces and navigating regulatory complexity. On this blog, she writes about EOR models, global payroll compliance, and international hiring strategies at
Compunnel Inc,
In early 2025, a major US healthcare system experienced a ransomware attack that disrupted patient care for 37 days. The organization had Multi-Factor…
Every cloud migration eventually reaches the same conversation. Engineering wants to move fast. Compliance requires that every data flow be mapped before…